You are using an out of date browser. It may not display this or other websites correctly.
You should upgrade or use an alternative browser.
You should upgrade or use an alternative browser.
Did you catch it ?
- Thread starter Tom-D
- Start date
Not everyone has the same risk level or risk tolerance. Just stay away from other people and your risk should be close to zero.pmanton said:We're 82 and 80. My wife is a heart patient. We DON'T want to catch this. Luckily we live on an airpark in rural AZ, so we're isolated.
Dimwits here are still doing buggy rides, happy hour, fly-outs for breakfast etc.
My fear is that they won't go home for the Summer. (We're full time residents)
A bit more detail in the original report - https://chicagocitywire.com/stories...-30-of-those-tested-have-coronavirus-antibody
30% of those tested would be roughly consistent with the 15% from the random sample in Germany.
I will be very interested to see what this would imply in terms of policy using the models such as Kissler et al’s. Is social distancing going to turn out to have been at all a wise strategy given this level of spread and asymptomatic infections?
Well, the serious models and preprints say basically that social distancing is unlikely to be sufficient in the US and may make things worse in the fall, if SARS Cov-2 is mildly seasonal.chemgeek said:Social distancing is especially important if you don't know who is spreading the virus. It's pretty much the only tool without testing. With testing isolation can be more targeted, and immune individuals turned loose.
I don’t know of any serious cost-benefit analyses used by our government in Arizona to justify the coercive measures they have put in place, either in terms of total deaths or lives that can be saved with the money that has effectively been spent on this by shutting down 1/4 of the economy.
Given what we now know about the likely characteristics of this virus - 0.3% fatality rate, R0 of 1.5-4, 50-80% of cases asymptomatic, and 15% of the population with anti-bodies, I don’t think one can rely simply on intuition. It requires more serious modeling and study to have even a rough idea, which probably isn’t very accurate, of what might work.
And yes, more testing will be key.
The 0.3% lethality rate comes from the study in Germany where they tested a random sample of households and 1000 people. That is the best estimate of the actual lethality rate of those infected, versus confirmed cases, for the general population which we presently have. It is likely much more lethal for the elderly and those with pre-existing conditions. That study also found 15% of the population with antibodies.Kenny Phillips said:A conona doesn't mean THE corona; many cold viruses are coronaviruses.
Of those with confirmed cases of COVID-19 in the USA, nearly 4% are dying. I find that to be a harrowing number. And, since not 100% of the population has been tested, we don't know how many have been exposed. (I would love to see 100% of the population tested, eventually.) I would be quite happy if 15% of the population had been exposed, not gotten sick, and thus were out of the system.
Should sheltering in place / isolation / quarantine been strictly voluntary? I have my opinion on that, but I also have knowledge of what humans will actually do.
Could it be different here in the US? Theoretically possible; however, that study is the best data we have so far and the report from Chicago is roughly consistent with those numbers.
Clearly more studies needed.
Can you provide a citation for the Iceland publication you are referring to? I found the recent article by Stock et al (http://www.igmchicago.org/wp-content/uploads/2020/04/Covid_Iceland_v10.pdf) but that estimated an 90% of cases asymptomatic, so I assume that is not what you are referring to.chemgeek said:We already have three published studies that have provided estimates of case and infection fatality rates from comprehensive testing of relatively closed populations of individuals: the Diamond Princess passengers (3000+), the village of Vo, Italy (about 3600), and a study in Iceland that tested approximately 10% of their population.
The daily updated data for Iceland are here: https://www.covid.is/data . They are interesting. They report 8 deaths thus far and 35,488 samples. If each sample is from an individual, and there are 1711 confirmed infections, that suggests an infection fatality rate of 0.47%. This would be close to the 0.37% (which as you note should be rounded to 0.4%, not truncated).
So compared to seasonal influenza, that corresponds to perhaps 3-5 times higher infection fatality rate (I agree "several" is a good qualitative descriptor there). Not 80X higher which is what some in the media were speculating about previously.
I agree these seem to be the best estimates about now. I would not describe that as "much more explosively" from a qualitative perspective. The measles, which is highly contagious, has an R0 of about 16. But the numbers are really the most informative.The R0 for influenza is around 1.3, whereas COVID-19 is around 2.3-2.6, which means it spreads much more explosively than the flu.
These estimates of the numbers, as I have stated before, strike me as being in a range where intuition is not going to tell us which policies are beneficial or harmful and whether social distancing as a strategy makes sense in terms of minimizing harm overall. Perhaps have a look at Kissler et al. 2020 https://doi.org/10.1101/2020.03.22.20041079 to see what modeling with these type of numbers says. Their conclusion is that a single period of social distancing will not be sufficient in the US and may make things worse in the fall if SARS COV-2 is moderately seasonal.
The preprint is in German here https://www.land.nrw/sites/default/...chenergebnis_covid19_case_study_gangelt_0.pdf .chemgeek said:I haven't yet been able to review a preprint or peer-reviewed publication of that study to understand what assumptions they made to arrive at that number from their serological testing.
My quite limited ability to read medical German suggests it was a random sampling of households with 1000 individuals enrolled. Also about 0.06% was the mortality rate in the total population. The same fraction in the US would suggest 198000 deaths in the US overall, about 3-4 times higher than the latest estimates reported by Dr. Fauci.
By way of comparison, there are about 2.8 million deaths in the US each year. So the upper estimate would represent about 7% of the total deaths due to all causes in the US in one year.
I think in terms of the sort of parameters being discussed here, a vaccine affects the R0 value, which is not a fixed item for a particular virus. As you immunize more of the population, fewer additional cases are infected for each case, thus reducing R0.Jeff Oslick said:We keep hearing these comparisons to the fatality rate for influenza, without recognizing that many influenza infections and deaths are prevented by fairly widespread use of the flu vaccines, particularly among the most vulnerable populations. If you remove the effect of flu vaccine use from the analysis I think the COVID-19 fatality rate would look much more comparable.
I do not know an historical value of R0 prior to flu vaccines. Clearly a vaccine would help with SARS Cov-2, though we don’t know if and when one might be available. Technology has advanced a lot since the 60s, but back then it took 6 years to produce the first mumps vaccine.
I suspect more people would take it if the efficacy is similar. Because the apparent lethality rate of SARS Cov-2 is perhaps 2-3X higher. But if that drops due to better treatments, one might see the same low rate of vaccination. The seasonal flu vaccines are not so high efficacy typically.
Likely better to state a number, rather than qualitative descriptions, which can be misleading. The estimated R0 for SARS-Cov-2 is about 2X that for the seasonal flu.chemgeek said:The intrinsic R0 for influenza is about 1.3, which is much lower than the estimated intrinsic R0 for SARS-CoV-2..
Personally, I wouldn’t call that “much lower”, just as I wouldn’t characterize it as “much more explosively”. Measles, widely considered a “highly contagious” disease, has an R0 of about 16.
As a short general summary of a comparison to seasonal flu, I like “it is about 2-3 times more deadly and twice as contagious”.
While the point is well taken taken that the doubling rate depends on R0, the relationship depends on the latency assumed in a model and has a different form than the equation given. (https://en.wikipedia.org/wiki/Basic_reproduction_number).chemgeek said:It is "much lower" because the R0 is an exponential factor, as in e^(r0*t). If you double the R0, you halve the doubling time. That's a very big deal for exponential growth. (5 doublings is 32x initial; 10 doublings in the same time period is 1024x initial. Huge difference in growth of raw numbers.) Measles is one of the most contagious diseases known, undoubtedly. Covid-19 has an R0 about double that of seasonal flu, based on current knowledge.
For a very simply model, the relationship between the doubling time, Td, and R0, would be as follows: Td = ln(2) tau / ln(R0). Agreed that a 2X change if R0 results in changing the timescale of the exponential growth by a factor of 2.
Since exponential growth always looks nearly vertical on an appropriate timescale, the practical question in the present case is whether the 2X difference in R0 versus the seasonal flu really impacts what should be done.
As modeled by Kissler et al. with these types of numbers, a single period of social distancing with relatively severe measures may be insufficient to avoid over-running existing healthcare resources in the US. If SARS Cov-2 is moderately seasonal, it may make things worse in the fall.
Are there any academic studies using the current data which suggest that coercive social distancing measures ordered by the government have increased the effective R0? While there have been a lot of reports in the lay press, there are a lot of other confounding factors that one would have to account for to reasonably demonstrate this has worked in the US. I have not seen any so far but this is rapidly developing.
I would very much like to see a publication and careful study of this sort with appropriate control for population density etc. Haven’t seen that yet.chemgeek said:Well, in NY, the effective R0 was reduced from 1.8 to 0.9 in about 4 weeks. The reduction can't be attributed to herd immunity, because only a small fraction of the population has been infected.
As I understand it, there are a number of possible issues with this analysis.
1. There are a number of cases where the data don’t line up so well.
2. The timing is often off, with the beginnings of the downturn being relatively early compared to the implementation of coercive lockdown measures.
3. Measured decreases in social mobility do not agree with the levels of coercive lockdowns enacted.
4. Since we don’t know the actual fraction infected yet, it is hard to know if this is some type of effect of saturating easily infected remaining population.
I agree that it is possible the observed increases in the doubling time may be due to social distancing. But there are other possible explanations. Would love to see a properly designed analysis. So far, none published that I know of.
And the important question, in terms of governments imposing coercive measures, is whether those actions in particular helped or hurt in terms of total mortality and morbidity.
What happens in the last two weeks? Is that supposed to be a data point at the end, or just an artifact? Or a point for the whole two weeks? And did you add that?deonb said:Here you go. Comparing deaths from all causes.
It's 2 weeks old though - take that red line on the right and double it.
View attachment 84838
I will be very curious to see when the numbers come out. In Europe as of about a week ago, total mortality was actually down somewhat, excepting Italy.deonb said:Ignore my 2-week thing, it's only a complication. There will be new data at the end of April. The point was just that even for the half we have right now, the count is much larger than any previous total deaths-from-all-causes count, including 9/11.
Thanks for the continued discussion as I am very curious about this issue.
For #2. Nationally the measured exponential growth rate began to drop about March 25. My understanding is that the predictions of the delay between implementation of coercive social distancing measures and the drop in propagation were for a greater delay than what was observed.
I would be quite happy to see a dataset with the timing of implementation of the policies and the confirmed case rates on a state by state basis. I can always be persuaded by the data.
My suspicion is that the relationship here is more nuanced and not so obviously clear. Therefore it takes some time and effort to tease apart the various factors. This is not a physics or chemistry experiment, but rather biomedical and social science where the evidence is often much softer and difficult to interpret than in the hard sciences.
One of my primary interests is whether the coercive orders made a difference. It is possible that people were distancing based on recommendations prior to the coercive orders, yet it may be that the coercive orders have been the primary thing causing other damage, such as deaths due to other causes and economic damage. That is a very important question from a policy perspective and measuring the relative contributions will require the type of data and analyses I have been discussing.
For #1. While the contrast between Kentucky and Tennessee is often held out as proof that social distancing works, epidemiologists in Tennessee note that actual measures of distancing obtained from cell phone records indicate more compliance in Tennessee, yet that is the state with the higher number of cases, so they don’t buy the explanation that differences in social distancing policies are the explanation.chemgeek said:I'm not sure I understand points 1 and 2.
For #2. Nationally the measured exponential growth rate began to drop about March 25. My understanding is that the predictions of the delay between implementation of coercive social distancing measures and the drop in propagation were for a greater delay than what was observed.
I would be quite happy to see a dataset with the timing of implementation of the policies and the confirmed case rates on a state by state basis. I can always be persuaded by the data.
Can you provide the data and your analysis? I have not had the time to try and pull this together myself yet but would be very happy to see it.The NY state data is an excellent case in point. You can (and I have) compared that data to other states and also to the US as a whole, excluding NY state, which was one of the first and earliest to implement stay-at-home policies. The difference in that data is stark, and if conforms very nicely to the expected outcome.
Well we have preprints on all sorts of other aspects of this. You say you’ve already performed an analysis. I imagine those who work in this area specifically have had plenty of time to do something similar. Where are those preprints? Perhaps they will be forthcoming, but until they do so, I think it is a bit premature to predict what they will say.It is probably too early to have peer-reviewed publications on this topic, because we are still in the middle of the outbreak.
My suspicion is that the relationship here is more nuanced and not so obviously clear. Therefore it takes some time and effort to tease apart the various factors. This is not a physics or chemistry experiment, but rather biomedical and social science where the evidence is often much softer and difficult to interpret than in the hard sciences.
I agree that the results from the recent studies in the US strongly suggest herd immunity is likely not a factor, at least not in the normal sense.Regarding point 4. There is no good evidence, even if one considers extremely optimistic estimates of exposure rates, that herd immunity is a factor in the current progress of the epidemic in the US.
What did you think of the validation procedures in the recent Stanford study? They manufacturer reportedly had something like 390 negatives against sera from prior to the epidemic.A proper study would include validation data (something analytical chemists are quite familiar with) to ensure it is not picking up false positives from non-COVID coronaviruses, which are very common.
Argument from authority. I’ll be convinced by the data, analysis, and publications. Where are they?There is overwhelming scientific consensus points to the importance of physical distancing in controlling the current outbreak.
Again, please provide citations. I have seen no preprints addressing this. Without citations to at least preprints, it seems unjustified to assert this.There is virtually no disagreement (I mean, is there really ANY disagreement on this point?) that physical distancing has reduced both morbidity and mortality due to COVID-19, and publicly available data supports that claim.
Agreed the cost trade offs are not a scientific question and that in the limit distancing has to work to stop the spread. The question is whether in this case the interventions used have worked, and if so, how well.If people are not exposed, they can't get sick and they can't die from the virus. Balancing economic and public health issues is another thing, and that is a question of ethics and sociology, not science.
One of my primary interests is whether the coercive orders made a difference. It is possible that people were distancing based on recommendations prior to the coercive orders, yet it may be that the coercive orders have been the primary thing causing other damage, such as deaths due to other causes and economic damage. That is a very important question from a policy perspective and measuring the relative contributions will require the type of data and analyses I have been discussing.
Thanks for the kind remarks. While I am largely in agreement with you on the political aspects, I will just comment on the science that you mention under #1.
The Chelsea, Massachusetts data says 1/3 of randomly selected are seropositive for antibodies. Wow. https://www.bostonglobe.com/2020/04...ples-taken-chelsea-show-exposure-coronavirus/
That is about twice the fraction from the Gangelt study in Germany and 10 times the 2.5-4% estimated in Santa Clara County. The fraction seropositive may reflect how far along a community is in the growth of the infection and these different numbers may reflect that.
As I imagine others here will be quick to point out (hat tip @chemgeek), SARS Cov-2 does appear to have an effective R0 of about twice the seasonal influenza from estimates early this month, so that it's doubling time is about half that of the seasonal flu. (But I really don't know yet what to make of the linear growth in confirmed cases in the last 2 weeks, that seems incompatible with exponential growth.)
The Chelsea, Massachusetts data says 1/3 of randomly selected are seropositive for antibodies. Wow. https://www.bostonglobe.com/2020/04...ples-taken-chelsea-show-exposure-coronavirus/
That is about twice the fraction from the Gangelt study in Germany and 10 times the 2.5-4% estimated in Santa Clara County. The fraction seropositive may reflect how far along a community is in the growth of the infection and these different numbers may reflect that.
Interesting, the numbers from that article about Chelsea would suggest an infection fatality rate of 0.33%. This is in rough agreement with the results in Gangelt and about 50% more, relatively speaking, than the estimates from the Santa Clara study of 0.12-0.2%. All are much lower than the feared 8% from initial reports and in an absolute sense on the same order as the seasonal flu for infection fatality rate.MuseChaser said:50 to 85 TIMES more people. Therefore, the mortality rate would seem to also be 50 to 85 times lower than previously reported.
As I imagine others here will be quick to point out (hat tip @chemgeek), SARS Cov-2 does appear to have an effective R0 of about twice the seasonal influenza from estimates early this month, so that it's doubling time is about half that of the seasonal flu. (But I really don't know yet what to make of the linear growth in confirmed cases in the last 2 weeks, that seems incompatible with exponential growth.)
What I am particularly curious about is the comparison which you said you made that shows clearly that the times of implementation of coercive and voluntary policies for distancing correlate with a change in the in the growth rate of the infections.chemgeek said:You can find the data on GitHub and explore to your heart's content. JHU has the largest dataset, although it can be harder to navigate. The NY Times has simplified and re-aggregated that dataset for confirmed cases and deaths, aggregated by states and counties in separate files. That dataset has the same data in an easier to use format.
I am aware of these different datasets regarding the reported cases, thanks, but where is the data about the policy implementation times?
And what methods of comparison did you use to conclude there was a relationship in the time series?
As I have noted repeatedly, I am not aware of any present preprints or studies that do that in a serious manner.
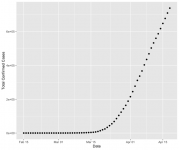
The US national rate of confirmed cases appears to be a linear growth mode for the last two weeks, quite strongly so actually. That strikes me as quite odd and indicating some other type of limited process. Other people have speculated it may reflect a limit on the number of tests which can be processed per day, but I have been unable to find a serious reference on that.Nationwide, the inflection point is a moving target (hasn't been reached yet) and logistic curve analysis points to somewhere north of 60,000 deaths. That's if nothing changes from the current situation.
(https://www.worldometers.info/coronavirus/country/us/ shows the US cases on both a linear and log scales.)
In terms of US confirmed cases, the overall trajectory looks consistent with an initial exponential growth phase but then striking some sort of limit that produces linear growth, rather than something having changed the exponential growth rate, which was my initial thought about it.
I do hope that whatever is going here limits deaths to that many. If one looks at the US national death rates, the curve strikes me as still fitting an exponential, with a weird bump on April 14. A davies test for changes in slope of the log of deaths as a function of time between March 16 and April 18 yields a highly significant result (p<2x10^-16) with 5 inflection points on March 30, April 3, April 8, April 12, and April 17.
Curious, what did you think of the controls which were run by the manufacturer of the kits used in the Santa Clara study? They tested against 371 pre-Covid samples with 369 negative results. It strikes me that argues that that test is not reacting with other coronaviruses which were around at the time, though I suppose depending on where the pre-Covid samples were obtained, they might not have contained the other coronaviruses.chemgeek said:Many if not all,of the current test kits are using antigens that have significant cross-reactivity with other common coronavirus strains that cause the common cold. False positives are going to be very prevalent, especially considering that the true negatives are expected to be 85-95% of the test pool. ELISA assays are notorious in the research lab for their ability to be insufficiently specific.
Article available here: https://www.medrxiv.org/content/10.1101/2020.04.14.20062463v1
No of course the confirmed cases are not a straight line overall. The question is, if you look at this on a log scale, once there were a reasonable number of cases it appeared to be on an exponential growth curve. Then for the last 4 weeks it has looked quite linear. See attached.chemgeek said:Both the US overall or NY state data has not grown linearly. You can see that by simply examining a full plot of the raw data. It's not a straight line. Both caseload and deaths data has closely followed a canonical logistic curve, which is a self-limiting exponential growth function typical of phenomena like epidemics.
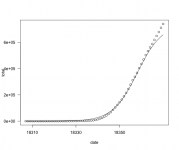
When I attempt to fit the total number of cases with a 5 parameter log-logistic model in R the fit for the same datapoints looks like the following (sorry about the sloppy scale labelling):
So I am wondering how one distinguishes a case where there is some underlying linear growth factor which has taken over from the case of a log-logistic model with a higher maximum so the curve doesn't turn over like that yet? I guess there is likely a way to make such a model comparison in R, but practically, at this point would one be able to distinguish those two alternatives in a statistically significant manner? It seems like the data may just not really be able to distinguish this but the normal course of epidemics would suggest there is a higher limit involved here where it will turn over. I guess I have to go read the IHME model...
Attachments
I have now read the IHME model paper as well as the description of the recent updates. A few observations.
This is an empirical model which basically fits curves to the observed growth rates relative to different interventions and then uses those curve fits to predict the results in other places and for future times.
The model uses a cumulative Gaussian error function to estimate case numbers as a function of time, not a log-logistic. (EDIT: Thinking about this more I am now a bit concerned about this. The cumulative Gaussian error function is symmetric about the middle and the roll up toward the middle and the roll off at the top are mirror images. The log-logistic function is rather different in that the roll off at the top tends to be more extended. This might result in making poor predictions about the tail end behavior - which is exactly where people have complained about the predictions of this model seeming unrealistic.)
The Wuhan data figured heavily in their initial formulation, though they have many other data points as well. Of course the Wuhan data is highly suspect but it is unclear how much of an effect overall this would have on their results.
They found that the overload of hospital capacity in the initial report was 25% for ICU beds and 7% of hospital beds.
It strikes me as a fairly good job of curve fitting. I have not seen yet a comparison of model outcomes to true predictions. We know recent revisions resulted in a 25% decrease in predicted deaths. Some of their predictions in the first iteration were clearly off, for example, that New York deaths would peak in the first week of April. I don’t think we really know yet how predictive this model is, especially not in quantitative terms.
I don’t think this modeling approach says much regarding whether social distancing measures, voluntary or coercive, have had an effect on the growth rate of cases or the magnitude of such effects. That was not really its goal and the authors assume that. Likely the data and some parts of the model could be used to explore that question.